
Strategic advisory
Evaluate market entry, growth opportunities and competitive positioning across the energy value chain.
Discuss your strategyENERGY & POWER MARKET RESEARCH
Explore market size, growth forecasts and competitive insights across energy, power and natural resources. Turn a changing industry into a clearer direction for your business.
For strategy, investment and business development teams.
Market intelligenceSize, demand and growth forecasts
Competitive perspectiveCompanies, technologies and value chains
Strategic contextTrends, opportunities and market dynamics
WHAT WE OFFER
From market exploration to strategic planning, find the right research support for your energy, power and natural resources business.
Evaluate market entry, growth opportunities and competitive positioning across the energy value chain.
Discuss your strategyShape the scope around your target technologies, regions and business questions for a more relevant view of the market.
Build your research briefExplore market sizing, forecasts and company analysis across power systems, clean energy, fuels and resources.
Explore the report libraryDiscuss ongoing research access, updates in your focus sectors and report packages for your team.
Explore access optionsEXPLORE RESEARCH AREAS
Browse original research covering energy, power, technology and natural resources.
View all 20 categories ↗
Research on electricity generation technologies, power plants and future capacity.
Explore reports
Market intelligence for solar, wind, bioenergy and clean power investment.
Explore reports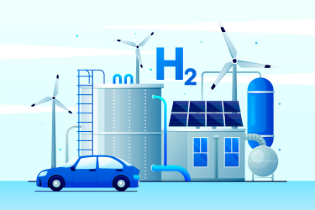
Hydrogen production, electrolyzers, fuel cells and emerging applications.
Explore reports
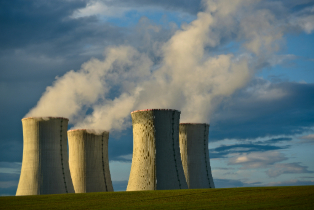
Reactor technologies, SMRs, fuel cycle and nuclear investment outlook.
Explore reports
Circular materials, recycling, resource recovery and reuse models.
Explore reports
Grid lines, substations, network modernization and electricity delivery.
Explore reports
Industrial electrification, process heat, efficiency and energy demand.
Explore reports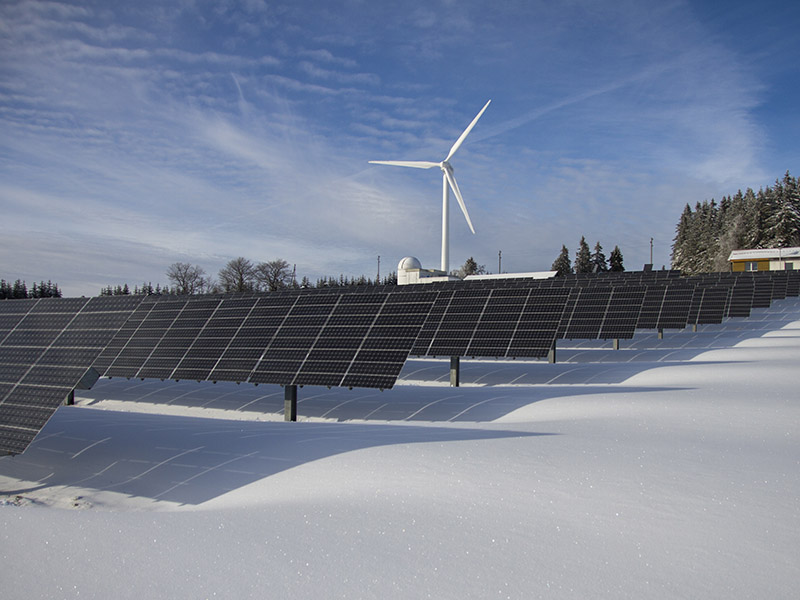
Building energy use, efficiency, distributed power and end-use demand.
Explore reports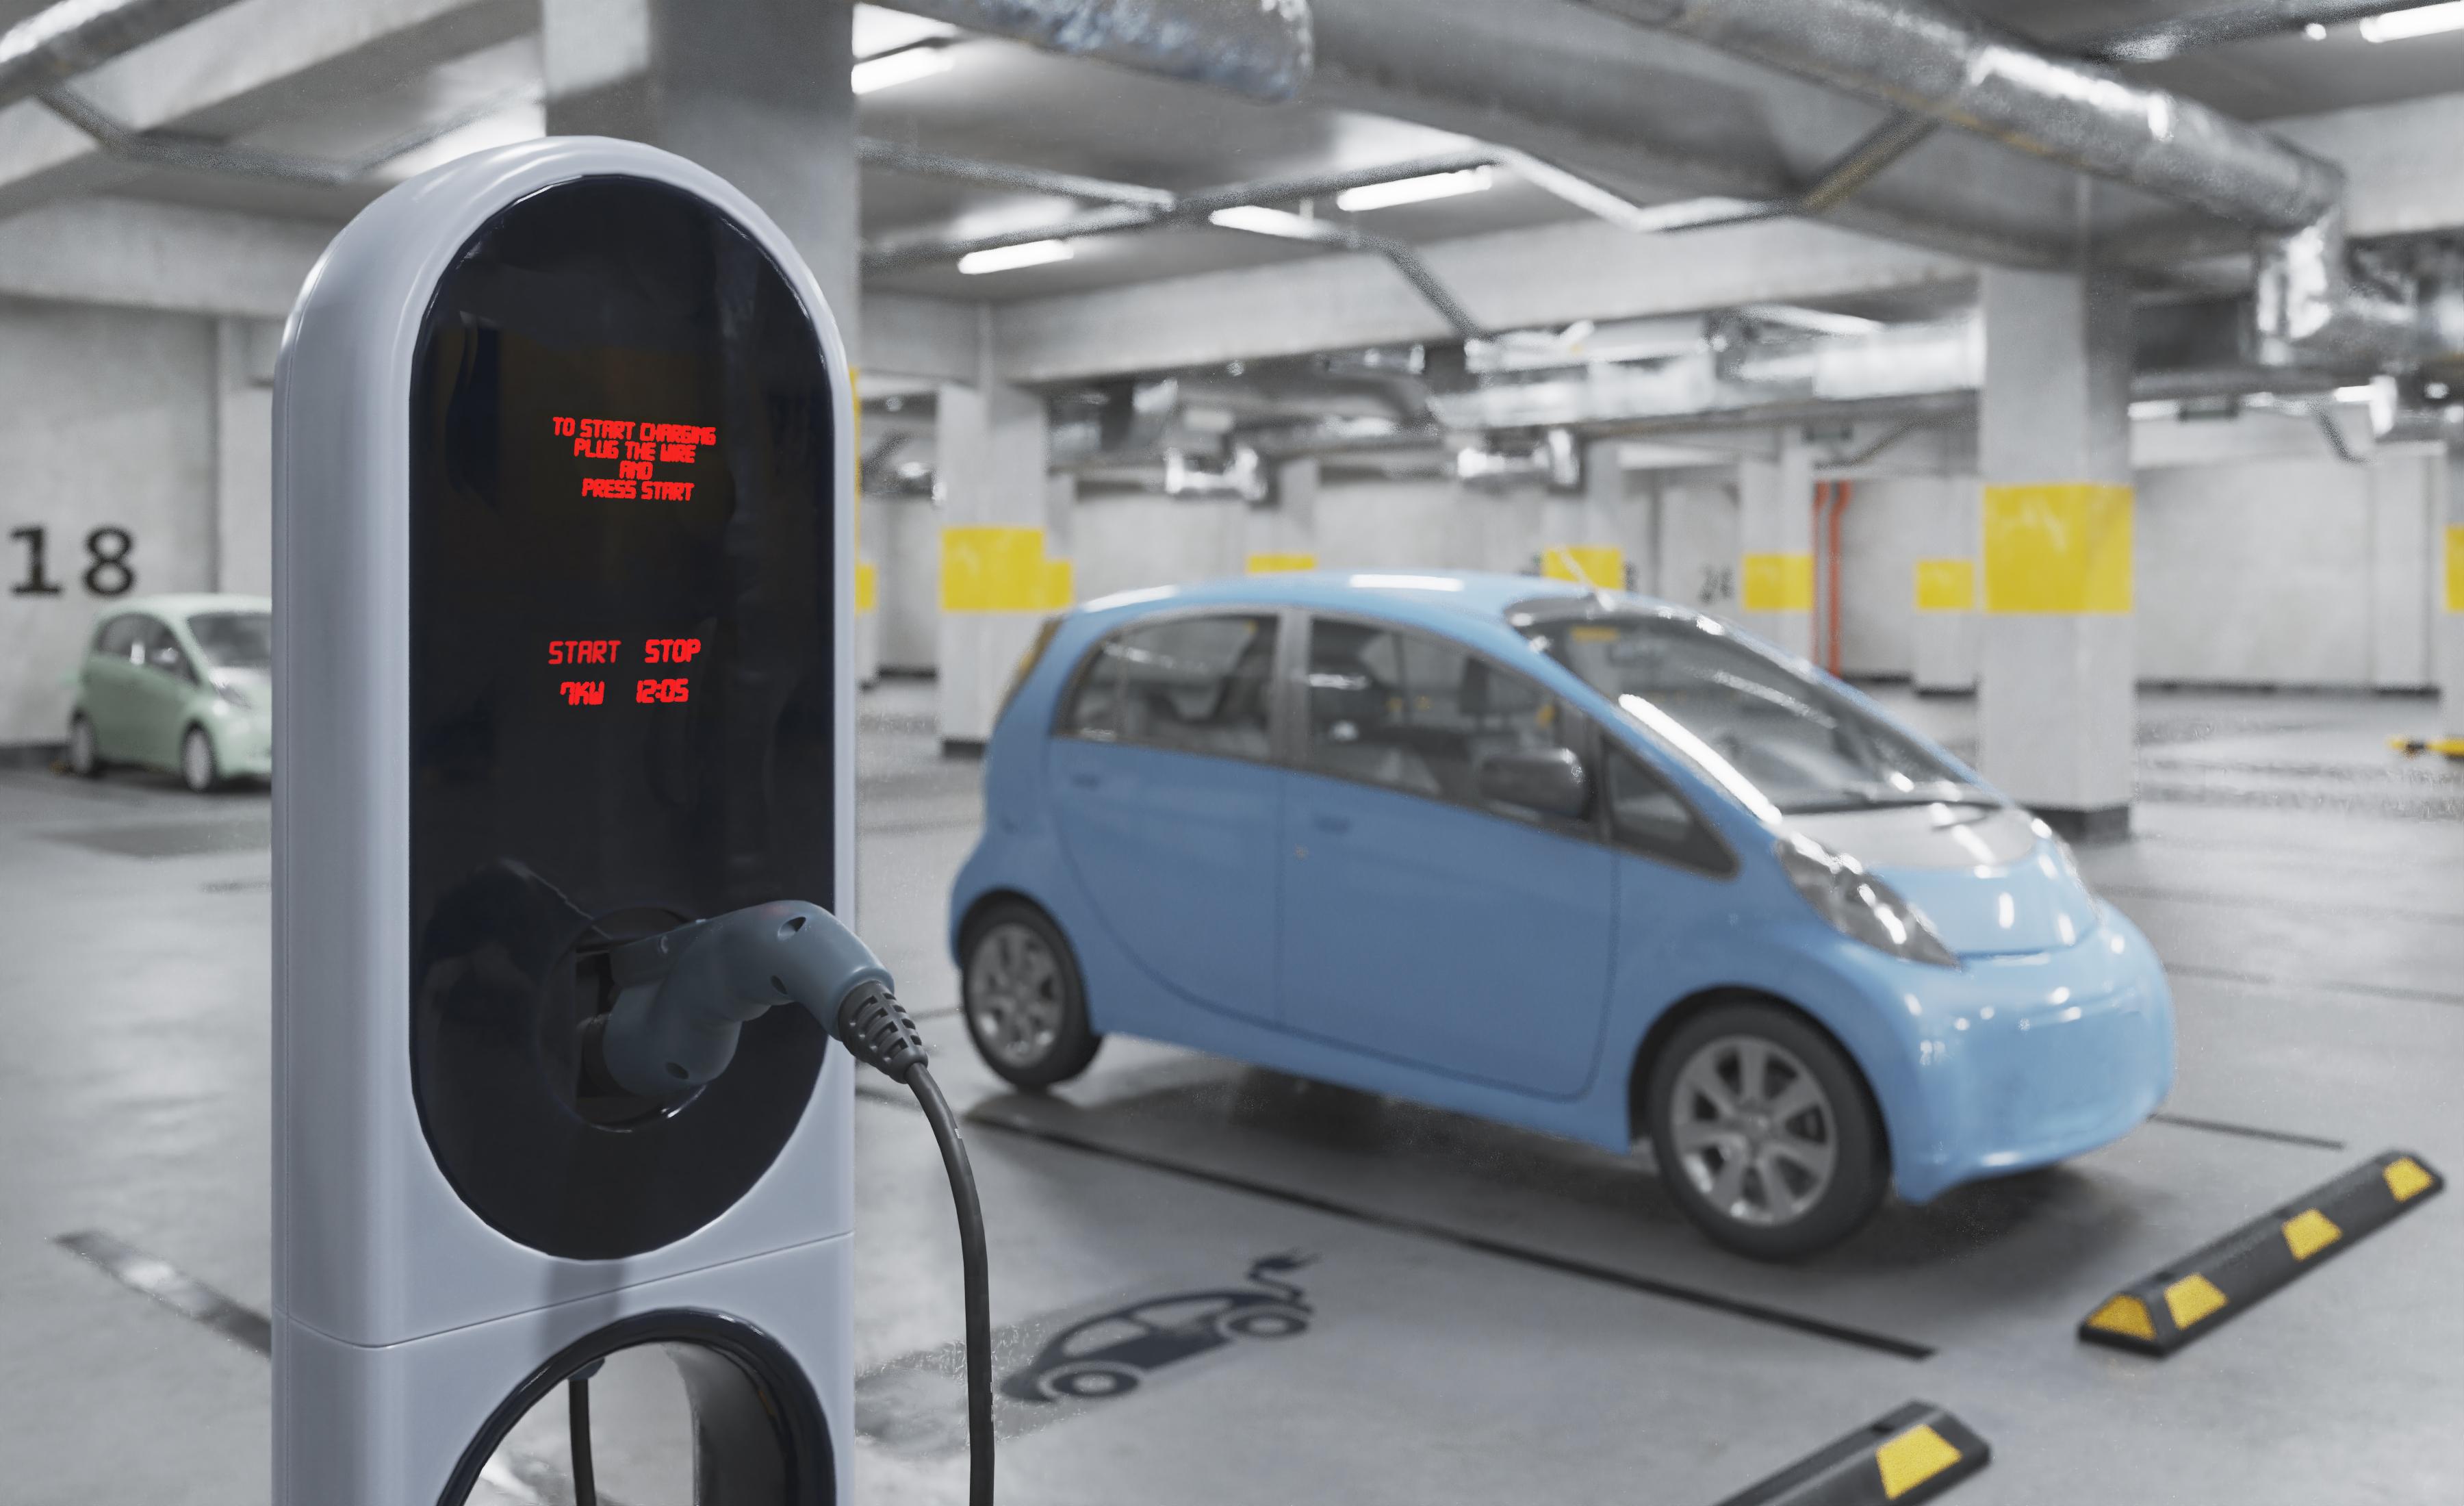
EV platforms, charging networks, power electronics and mobility.
Explore reports
Emission reduction technologies, electrification and transition strategy.
Explore reports
Green hydrogen, low-carbon fuels, electrolysis and fuel supply chains.
Explore reports
Smart buildings, urban energy, IoT systems and digital infrastructure.
Explore reports
Coal, mining technology, resources and extractive-sector intelligence.
Explore reports
Smart metering, utility analytics, grid flexibility and demand.
Explore reports
Battery storage, grid-scale systems and flexibility technologies.
Explore reports
Power plant equipment, turbines, boilers and control technologies.
Explore reports
Substations, grid interconnection, expansion and network assets.
Explore reports
Energy analytics, automation, AI and digital operations.
Explore reports
Carbon capture, utilization, transport and storage value chains.
Explore reportsOUR VALUE PROPOSITION
Understand the scale of opportunity, compare the data and track the changes shaping your next decision.
 SIZE THE OPPORTUNITY
Assess market size and growth potential across energy technologies, regions and end-use sectors.
 COMPARE THE EVIDENCE
Compare market segments, regional demand and company performance with research focused on your business questions.
 UNDERSTAND WHAT’S NEXT
Explore how technology adoption, policy shifts and investment priorities influence energy and power markets.
Looking at a specific market? Tell us the sector, region or technology you want to understand.
Talk to our teamTHE ENERGY PICTURE / 2025
A closer look at the numbers reshaping energy and power.
5.15TW
Global renewable generating capacity at the end of 2025.
692 GWAdded in 2025
+15.5%capacity growthInstalled capacity share at year-end.
IRENA · 2026 (opens in a new tab)85.6%
Renewable share of global additions.
IRENA · 2026 (opens in a new tab)≈3%
Year-on-year increase, estimated by the IEA.
IEA · Global Energy Review 2026 (opens in a new tab)108GW
+40% worldwide additions versus 2024.
IEA · Global Energy Review 2026 (opens in a new tab)Sources checked Annual data, not a live feed.
Data refer to 2025 unless another year is shown. Historical bars show year-end renewable power capacity on a shared zero baseline; labels are rounded to two decimals. 5.15 TW is rounded from 5,149,280 MW. The 692 GW addition is rounded from 691,940 MW.
GW and TW measure power capacity: 1 TW = 1,000 GW. Installed capacity shares are different from electricity generation shares. Annual figures include publisher estimates and may be revised.
Sources: IRENA, Renewable capacity statistics 2026 (© IRENA 2026); IEA, Global Energy Review 2026 (CC BY 4.0).
DID YOU KNOW?
Three signals to watch across renewable power and electricity demand.
Explore industry insights SOLAR / 2025
510GW added
THE SCALE OF SOLAR
Solar accounted for nearly three-quarters of renewable capacity added worldwide in 2025, with 510 GW installed during the year.
Read the IRENA findings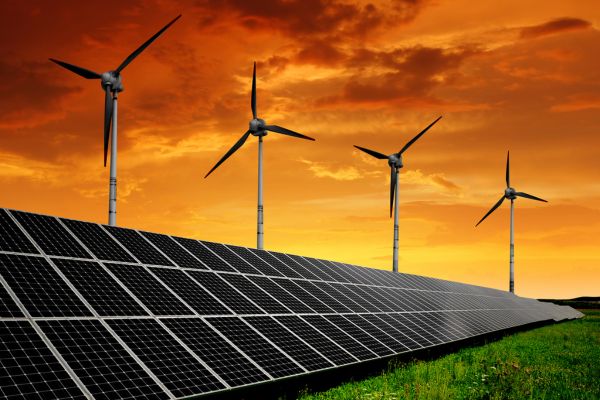
WIND / 2025
159GW
Global wind capacity increased by 159 GW in 2025, alongside the continued build-out of solar.
View the capacity dataELECTRICITY DEMAND / 2025
≈17%
Data-centre electricity use grew by around 17% globally in 2025, adding about 70 TWh of demand.
Read the IEA analysis2025 annual data · Sources: IRENA, Renewable capacity statistics 2026 (© IRENA 2026); IEA, Global Energy Review 2026 (CC BY 4.0). Figures rounded by the publishers. Source links open in a new tab.
THE RESEARCH LIBRARY
Explore the latest reports across energy, power and natural resources.
Renewable Energy
All-in-one Inverter Market Size, Share & Industry Analysis, By Integrated Conversion Configuration (Hybrid PV-plus-storage DC-coupled, Other integrated off-grid and AC-coupled architectures), By AC Output Phase (Single-phase equipment, Three-phase equipment), By Rated AC Output Power (Up to and including 6 kW, Above 6 kW), By End-use Installation (Residential self-consumption and backup, Commercial, industrial and off-grid non-residential), and Regional Forecast, 2026-2034
Transmission & Distribution (T&D)
All Dielectric Self-supporting Cable (ADSS) Market Size, Share & Industry Analysis, By Jacket build (Single-jacket ADSS, Double-jacket and reinforced ADSS), By Deployment use (Electric utility data, Broadband and rural access, Enterprise and other private networks), By Span Design Class (Up to 300 meters, Above 300 to 800 meters, Above 800 meters and special spans), By Fiber Count (Up to 48 fibers, 49 to 144 fibers, Above 144 fibers), and Regional Forecast, 2026-2034
Industrial Energy
Alarm Power Supply Market Size, Share & Industry Analysis, By Power Technology (Switch-mode Power Supply, Linear and Transformer-based Supply), By Primary Application (Fire Detection and Signaling, Intrusion and Security Alarm, Integrated Safety and Access Alarm), By Equipment Role (Dedicated Monitored Supply and Charger, Signaling Power Expander, Embedded Alarm Power Module), By Rated Output (Up to 3 A, Above 3 A to 8 A, Above 8 A), and Regional Forecast, 2026-2034
Industrial Energy
Aircraft Power Supply System Market Size, Share & Industry Analysis, By Electrical Architecture (AC-centric, DC-led and Hybrid AC/DC), By Principal Equipment Function (Generation and Regulation, Conversion, Distribution and Protection), By Aircraft Class (Commercial Transport, Business, General and Defence Aviation), By System Fitment Role (Primary Electrical System, Secondary and Emergency System), and Regional Forecast, 2026-2034
Industrial Energy
Aircraft Ground Power Supply Market Size, Share & Industry Analysis, By Primary Energy Architecture (Grid-fed Solid-state, Independent Energy GPUs), By Aircraft Output (400 Hz AC Only, 28 V DC Only, Combined AC and DC), By Deployment Format (Fixed Gate or Bridge, Mobile Towable, Self-propelled or Hand-portable), By Primary Use (Commercial Airport Stands, Other Aviation Support), and Regional Forecast, 2026-2034
Renewable Energy
Airborne Wind Energy Equipment Market Size, Share & Industry Analysis, By Wing Architecture (Flexible Soft Wing, Rigid or Semi-rigid Wing), By Energy Conversion (Ground-based Generation, Airborne Generation), By Rated System Capacity (Below 100 kW, 100?499 kW, 500 kW and Above), By End-use Application (Remote & Off-grid, Construction & Temporary Sites, Utility & Grid Demonstrations, Maritime & Other), and Regional Forecast, 2026-2034
6 reports